
At ~10:52 EST the stock hit its low, then abruptly turned higher. The Tick Chart snap is included (click to enlarge).

The company traded over 7,400 options on total daily average option volume of just 1,355. The largest trade was a 3,434 lot Aug 47.5 call purchase about thirty minutes into the stock rise. Calls traded on a 19:1 ratio to puts. The Stats Tab and Day's biggest trades snapshots are included (click either image to enlarge).


The news broke of a potential buyer. The company quickly responded:
Hasbro Inc said it is not involved in any talks regarding a potential sale of the company, despite a news report that said it had been in negotiations for a possible leveraged buyout.
The No. 2 toymaker s shares rose as much as 9 percent in pre-market trading after the Wall Street Journal reported that it was in early negotiations with Providence Equity Partners to take the company private.
Hasbro confirmed it was approached by a private equity firm regarding a transaction, but it did not name the firm and its board had decided against pursuing it.
A source familiar with the matter told Reuters on Thursday Providence has had talks with the No. 2 U.S. toymaker. Providence was unavailable to comment.
So a "denial."
The Options Tab (click to enlarge) illustrates that the Aug 47.5 calls are mostly opening (compare OI to trade size). You can also see earnings are in that cycle.

I don't see an OI even in the two thousand range, so the 4,500 total of the Aug 47.5 calls that traded are significant.
The Skew Tab snap (click to enlarge) illustrates the vols per strike per month. You can see the slightly kinked up skew right on the July 47.5 line. It's a little surprising that the Aug 47.5 calls didn't react more severely. Seems like a call spread could set up if you don't think anything is happening in July.

Finally, the Charts Tab (6 months) is below (click to enlarge). The top portion is the stock price, the bottom is the vol (IV30™ - red vs HV20™ - blue). The yellow shaded area at the very bottom is the IV30™ vs. the HV20™ vol difference.
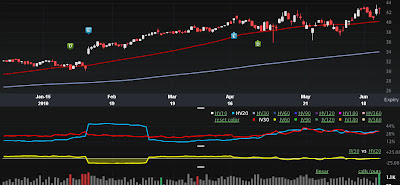
We can see the stock popped on earnings in late Jan, and since then has steadily risen. We'll see how this plays out, usually just a bunch of saber rattling. But then again, if someone bids for the company, the stock should jump, regardless if the company is "interested."
This is trade analysis, not a recommendation.
Legal Stuff:
http://www.livevolpro.com/help/disclaimer_legal.html
No comments:
Post a Comment