60,000 of these same butterflies traded 5-24-2010 (four days ago).
*****************
EEM (iShares MSCI Emerging Markets) is trading 38.10, down 1.7% with IV30™ up 8.8%. The LIVEVOL™ Pro Summary is below.

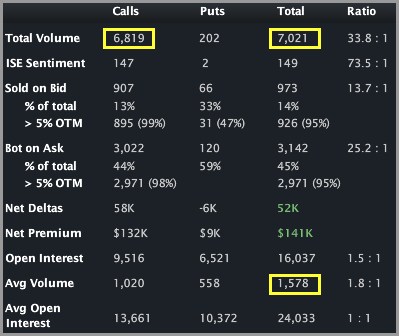
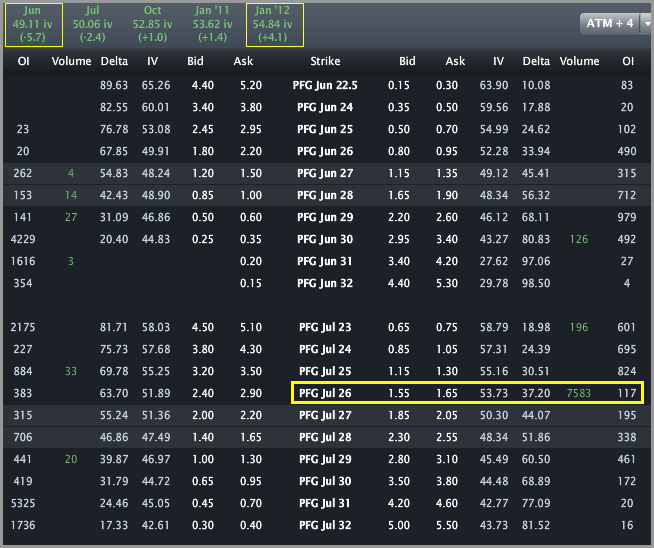
The ETF has traded over 500,000 options on total daily average option volume of 271,400. The puts have traded on an 8:1 put:call ratio. The largest trade, accounting for 300,000 contracts, was a Jun 25/30/35 put butterfly. The Stats Tab and Day's biggest trades snapshots are included (click either image to enlarge).


The 25/30/35 butterfly PnL is included (click to enlarge).
Price: $0.48 + $0.03 - 2*$0.11 = $0.29
Outlay (Max Loss): 100 * 75,000 * $0.29 = $2,175,000
Max Gain: 75,000*100*($5 - $0.29) = $35,325,000

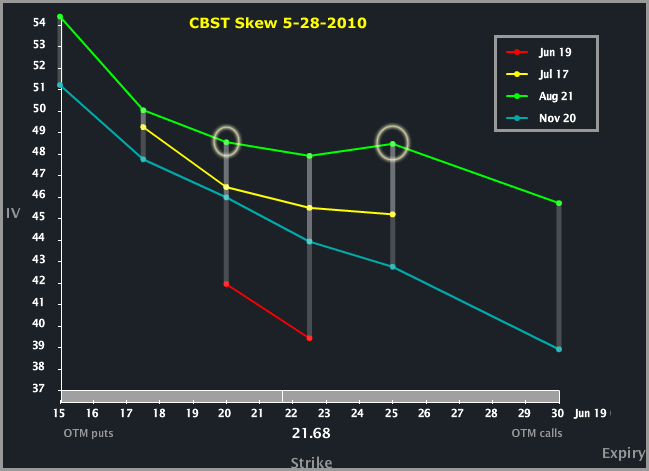
The trade makes $35 million at expo if EEM pins at or near $30. The Skew Tab snap (click to enlarge) illustrates the vols in the trade.

It's actually a very pretty skew. Essentially a perfect shape. I don't see this as a skew bet, it's a delta bet.
Finally, the Charts Tab (6 months) is below (click to enlarge). The top portion is the stock price, the bottom is the vol (IV30™ - red vs HV20™ - blue). The yellow shaded area at the very bottom is the IV30™ vs. the HV20™ vol difference.

The 52 wk. range is [30.12 46.66]. The one phenomenon that jumps out at me is the color of the volume bars at the bottom (circled). You can see they are mostly red - this indicates a pre-dominance for open order put purchases by customers on ISE. Or, in English, bearish customer order flow.
Make no mistakes - this is a bet that reaches max gain if the Emerging Markets Equity Index hits a new low in the next four weeks.
This is trade analysis, not a recommendation.
Legal Stuff:
http://www.livevolpro.com/help/disclaimer_legal.html