There are also options on the VIX. VIX options are fascinating because it’s a set of derivatives on a derivative on a derivative that measures implied volatility of options (another derivative). Here it is:
SPX -> S&P front month options -> VIX -> Vix Futures -> Vix Options
To make things even more interesting, we calculate a theoretical 30 day, 60 day, and 90 day (IV30, IV60, IV90) option for over 3000 underlyings in real time using our live systems, and archive this data historically. So, for the VIX, we have a theoretical 30 day option based on the implied volatilities of the VIX options.
One question we get from our customers all the time is how we calculate the IV30, IV60, and IV90. The simple answer is with brute force. We actually calculate the implied volatility on the bid and ask for each option for each underlying, and we then do a variety of proprietary weighing techniques to help keep the index clean (saving us from things like unusual spreads and other strange market activity). When all else fails, we have to figure it out and do it manually.
Also, we use a method called “forward indexing” that helps us out greatly on issues like cost of carry for things such as dividends, negative interest rates when the underlying is hard to borrow. Forward indexing in this case is basically extracting the implied underlying price from the options prices, since the market makers as a community must have the correct cost of carry to provide a two sided market at all times.
When we added VIX options to our systems, we examined whether our calculation methodology was appropriate for options on futures.
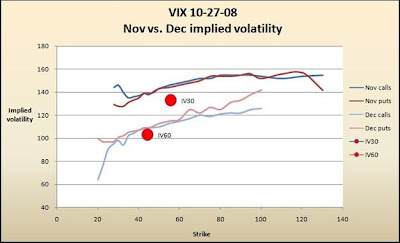
For this test we will be looking at October 27, 2008. This was when VIX was very close to its top, and at the peak of the implied volatility for the VIX options while the market was in freefall. On this day the VIX closed at 80.06, while the S&P closed at 848.92. Nov futures for VIX closed at 59.3 and Dec futures closed at 45. One benefit of having several years of tick data is the ability to extract data for research. I pulled the data for the VIX, VIX futures, and VIX options at exactly 3:45 (15 minutes to the close) on that day to have a peek at what was going on.
The way forward indexing works is finding the strike where difference of the call and put midpoints is the smallest. These strikes are highlighted above. Then take the difference and add it to the strike to solve for the implied underlying. This is basically where the options are saying the underlying is; normally we would use interest for equities, but for this example for futures we will use it as is.
At 3:45 PM EST on October 27, 2008, the actual Nov future is 56.00, and our implied future derived from the Nov option is 55.75. Also, the Dec future is 44.60, and our implied future derived from the Dec options is 44.3. So far, so good!
The next step is to take the new implied future prices, and run those against each month to solve for the implied volatilities. The main quality check everyone needs to be aware of is that put-call-parity is respected and the values that the calls and puts have are approximately the same volatility, especially for the at-the-money options. For Nov, the 55 calls are 146 vol, the puts are 144. For Dec, the 45 calls are 109 vol, the puts are 109 vol. Nice.
Finally, let’s dive into the skew.
The first thing that jumps out at me immediately is the fact that the skew is a frown, not a smile. This is because the VIX is mean-reverting, and mathematically does not use a lognormal distribution. In other words, VIX is somewhat range-bound; it cannot go to 0 and cannot go to 500 (we hope). The traders know this and the bids / offers of the options reflect this.
Second, the IV30 is lower than the Nov options. This is because there are 25 days till Nov expiration. This means 25 days of IV30’s weight comes from November, and 5 days come from December. This drags the IV30 lower. Our conclusion at the end of the test is that the methodology is sound, the calculations line up, and the IV30 and IV60 are solid measurements of implied volatility over time for VIX options.
Overall, the IV30 and IV60 are meant to give a clear unit of measurement for volatility over time. We use this mostly for charting, identifying 52 week high and lows for implied volatility, scanning, alerts and much more in our applications.
Below is a snapshot of the VIX chart with the HV30 vs. IV30 vs. IV60 terms. One interesting thing to look at is how high the HV30 is during this time.
Vix and more - Ten Things Everyone Should Know About the VIX
CBOE VIX FAQ


No comments:
Post a Comment