Friday, December 11, 2009

JPMorgan Chase & Co. (JPM) and (BAC) - Another Bank Butterfly

JPM is trading ~40.90 on the day the warrants were sold by the government. You can see the LIVEVOL™ Pro Summary below.


A look at the Company Tab shows that JPM averages ~115,000 options traded a day. Today over 255,000 have traded with 2 hours left in the day. You can see the snap below (click to enlarge).


The biggest trade of the day was 25,000 Jan 2011 50/60/70 butterflies. The day's biggest trades snap is below.


Someone paid 2.58 + 0.38 - 2*0.94 = 1.08 x 25,000 x 100 = $2.7 million dollar bet. The pay off of the butterfly is included below (click to enlarge).


Details:
Max. Gain: $22.3 million
Max. Loss: $2.7 million
BE (low): 51.08
BE (high) $68.92

Someone is willing to bet $2.7 million to win $22.3 million if JPM can get to $60.

For the few thousand of you loyal readers of this blog you may be experiencing some de ja vu. BAC ring a bell?

This is the second massive multi-million dollar bet on a big bank going up through the use of a butterfly.

For you new readers - see below.

------------- THIS IS FROM 11/20 (3 weeks ago) -------------


I saw a huge trade go up in BAC on the ticker (lower left hand side of the application). It was 100,000 Jan 2011 30 Calls. You can see the ticker snapshot below.


When I looked at the Company Tab I saw that it was in fact one leg of a butterfly. Specifically, the trade was:

Buy Jan 2011 20/30/40 Butterfly for 1.20 vs selling stock at 16.10 with 20 delta. The Company Tab snapshot is below as well as the Options Tab (click on images to enlarge).


So what does that mean? Here's the analysis on the day of expiration in January 2011:

Sell 1 million shares of stock @ 16.10
Buy 50,000 Jan 2011 20 Calls
Sell 100,000 Jan 2011 30 Calls
Buy 50,000 Jan 2011 40 Calls

Paid $6,000,000 for the options ($1.20 x 50,000 x 100)
Break Even Low: 10.10
Break Even High: 22.475
Break Even Highest: 35.025
Max Gain: $30,100,000
Max. Loss: Unlimited. At $40 loss is $29,900,000.
The bet loses an additional $1,000,000 for every dollar the stock goes above $40.

This is a bullish bet unless BAC completely collapses below $10 or rips over $35.

You can see the pay off diagram below (click on images to enlarge):


Legal Stuff:
http://www.livevolpro.com/help/disclaimer_legal.html

Thursday, December 10, 2009

Analogic (ALOG) - Waiving the White Flag?

ALOG is trading at around 35.30; down from poor earnings. The IV30™ is down from earnings which were announced AMC yesterday. The LIVEVOL™ Pro Summary is below.


The company averages 220 option contracts traded a day; it has traded over 5,000 options with an hour to go. The big trade was a 5,000 lot - a sale of the Jan 40 calls @ 0.25. You can see the Company Tab snap and the largest trades snap. Note also that the stock volume is higher today than usual (click the images to enlarge).


The Options Tab (snap below - click to enlarge) shows that the OI in the Jan 40 calls is small(ish) - the trades today were opening. However, OI in the Jan 45 calls is large - about 5,000.


Looking through Level II on the Options Tab I found the date that the Jan 45 calls traded. It was Dec. 4. The Time & Sales Tab from that date on those options is below. We can see those calls were also sold 4500x. They traded 0.35 versus 0.30 x 0.55 market (very likely a sale). You can click the image below to enlarge it.


The Charts Tab (snap below - click to enlarge) shows the stock price plummeting over the last week - and continuing to do so after earnings.


Even though stock has traded much more actively today I do not think these calls are trading tied to stock (I don't actually know for sure). The company confirmed its 0.10 dividend ex in January. The Earnings & Dividends Tab snap below (click to enlarge) shows that company has disapointed for the last three quarters. Further, the company has a total of 0.08 in earnings in six months and they have paid out 0.20 in dividends.


I'm not sure what's going on, but looking at the dipping stock chart, consecutive missed earnings, a dividend payout that is 250% of earnings over the last 2 cycles and 10,000 calls sold in six calendar days. Kinda looks like they are waiving the white flag...

Legal Stuff:
http://www.livevolpro.com/help/disclaimer_legal.html

Gildan Activewear (GIL) - Anatomy of a Winning Trade

GIL is a $2.4B manufacturer and marketer of activewear. The LIVEVOLTM Pro Summary is below.


The company averages 470 option contracts a day - in the first 1.5 hours of trading over 5,400 contracts have traded. The Company Tab snap is below (click to enlarge).


The largest trades of the day have been purchases of the March 15 puts. The largest trades of the day are posted below - green indicates trades on the offer (cust buying). You can click the image to enlarge.


The snapshot of the Options Tab (below) shows that the volume today is very close to the open interest. Click the image below to enlarge it.


By clicking the strike we can see the Level II pop up. This pop, amongst other things, displays the OI chart. There is a clear increase in OI in one day in these puts on 10/29 (implying the opening trades were 10/28). The Level II pop up is below (click to enlarge).


By going to the Time & Sales Tab to that date and the March 15 puts, we can see that the opening trades were sales (red implies a trade on the bid - cust selling). Note also that the 1.30 trade is a sale on a 0.30 cent wide market (1.30 x 1.60). When I see size trades on the NBBO of wide markets it makes me feel even more strongly that the order flow has information. i.e. someone believes this is a money making bet so much that they do not tip their hand with a negotiated price; they just hit/take what the NBBO bids/offers.


So what's what? It looks to me that someone sold 3500 Mar 15 puts @ 1.30. Today they are buying them back for 0.35. That $0.95 x 3500 x 100 = $332,500 gain in 6 weeks. Nice trade. Remember this symbol - if another large opening trade goes up on the bid or offer of a wide NBBO, maybe it's worth investigating.

Legal Stuff:
http://www.livevolpro.com/help/disclaimer_legal.html

Wednesday, December 9, 2009

Dril-Quip (DRQ): Call Buyers in Takeover Candidate

DRQ is a $1.62B manufacturer of drilling equipment. The LIVEVOLTM Pro Summary is below.


The company averages 401 option contracts traded a day - today with an hour left in the trading day - 1954 contracts have traded. And every single trade is a call - zero puts have traded. You can see the Company Tab snap below (click to enlarge).


1500+ of the volume is the Jan 60 Calls against OI of just 25. These are all opening trades. You can see the day's largest trades (Company Tab) and the Options Tab snap below (click to enlarge).


This may be one to keep an eye on; opening call purchases on a small(ish) driller in a industry known for consolidation. This name at one point was a takeover candidate.

Legal Stuff:
http://www.livevolpro.com/help/disclaimer_legal.html

Wisdom Tree Chinese Yuan (CYB) - Profit from Nothing: Call Roll

CYB is an ETF tracking the Chinese Yuan. You can see the LIVEVOLTM Pro Summary below.


The ETF averages 491 option contracts trading a day but in the first 2 hours has done over 28,600. Further, over 28,300 have been calls. You can see the Company Tab snap below (click image to enlarge).


The largest trade, essentially the entire volume, was ~14,000 Apr 25/Jul 26 Call spreads (buying Apr - I believe). The largest trades from the Company Tab are below.


That trade, in and of itself, is positive delta. You can see the deltas from the Options Tab below (click to enlarge). PIMCO recently came out as bullish on the Yuan - belief that Beijing will soon ease its grip on its currency. My first inclination was to assume this was a bullish bet along those lines. However, notice the OI - Apr 25 Calls might be closing, July 26 are definitely opening.


The OI on the Apr 25 calls popped twice - once on 11/12 and once on 11/24. I took a look at the trades on 11/11 and 11/23. 11/11 was dubious as to direction (they crossed mid-market). But the 11/23 trades all posted on the bid (sales by cust). I have included those below (click to enlarge).


Since those trades caused an OI increase it must be that the trades on 11/11 were also sales. So what?

That means buying Apr 25 calls is most likely closing the sales from prior. The sale of the Jul 26 Calls (opening) are new sales. In my opinion this was nothing more than a call roll from Apr to July. Rolls are not that unusual, this month combination given that we are in Dec is pretty weird. That makes me slightly less confident in the analysis. Either way, this is an exellent opportunity to study unusual order flow which at times is nothing more than the same bet moving months (rather than an actual new position).

If this was a roll - the sale @ $0.75 and purchase back for $0.50 is 0.25 x 15,000 x 100 = $375,000 gain simply winning b/c the Chinese gov't did what they said they would do - nothing.

Legal Stuff:
http://www.livevolpro.com/help/disclaimer_legal.html

UPDATE: HHGREGG INC (HGG) - Does History Repeat?

There were reports that the trades yesterday (see blog below) where delta neutral (traded with stock). The delta LIVEVOLTM Pro has on that line is 30 (see options tab snapshot in previous blog). So the trade was: Buy 1 put: Buy 30 shares of stock (using 30 delta). This is equivalent to buying 7 puts for every 3 calls (a very bearish lopsided straddle).

The stock tie is not that surprising, as getting that many options up in this issue would almost certainly move the market against the buyer without tieing to stock. It is a vol bet - and a bearish one at that in my opinion.

Tuesday, December 8, 2009

HHGREGG INC (HGG) - Does History Repeat?

HGG is trading ~21.70 yielding a $600 million market cap. The company is a retailer of video products. The LIVEVOLTM Pro Summary is below.


The company averages 402 option contracts traded a day - today over 10,000 options have traded hands with 2 hours still to go in the trading day. 10,373 (99.4%) of the options were puts. Even further, 9,912 were the Jan 20 puts - mostly purchases (if not all). The Company Tab is included below as well as the largest trades for the day (all Jan 20 Puts). Click the images to enlarge them.


From the Options Tab snapshot below (click image to enlarge) we can see that the open interest (OI) in the Jan 20 Puts is just 104. These put purchases are opening orders.


I took a look at the Charts Tab and saw a few interesting things. On 9/8 this company had another huge trading day - this time it was the Oct 15 Puts trading 13,000+ times. I have included the 20 largest trades of the day (from the Charts Tab) below. Click the image to enlarge it.


From the snapshot of the Charts Tab (below - click it to enlarge) you can see the last time this happened - i.e. someone bought huge size in puts one month out (in Sep bot Oct puts) the stock went down within 9 calendar days from 17.13 (9/8 high) to 14.51 (9/17 low) or 15%.


So now we have a similar bet. Buying massive numbers of puts (~$1,000,000 bet) in the back month (second month) with the stock rallying. Add to the mix that this is a specialty retailer of technology going into Christmas and you have yourself a possible story.

Legal Stuff:
http://www.livevolpro.com/help/disclaimer_legal.html

Monday, December 7, 2009

Associated Banc-Corp (ASBC) - Vol Seller

ASBC is a $1.3B diversified multi-banking holding company. You can see the LIVEVOLTM Pro Summary below. Note the decline in IV30TM today.


The company averages 235 option contracts traded a day. Today, with over an hour and a half to go in the trading day, over 3,700 option contracts have traded. Further, every single trade has been a call (zero puts traded). You can see the Company Tab snap shot below (click image to enlarge).


You can see from the Options Tab (snap below) that the vast majority of these are opening orders in the Dec 10 Calls (3600+ traded vs. OI of 16). You can click the image to enlarge it.


So this is bullish right? Not so fast. You can see the largest trades of the day below from the Company Tab.


Note the red color - the options are trading on the bid. It's seems that people are selling this front month vol and not doing a whole lot else (at least today). You can see a snap shot of the vol chart (IV30TM (red) vs. HV30TM) below (click image to enlarge).


I have highlighted an area where the stock price dropped and the vol popped. That day there was unusually high one-sided opening order put buying by customers (ISE sentiment - the red bar in the volume legend at the very bottom). This one may be worth looking into - pretty one sided order flow today after a vol spike.

It's also interesting to note that this company is a relatively large holding in a number of dividend paying etf/indices (like Morningstar). TSCM (thestreet.com) recently posted an article about insiders at these high div payers selling stock. Hmmm...


Legal Stuff:
http://www.livevolpro.com/help/disclaimer_legal.html

Thursday, December 3, 2009

Jackson Hewitt (JTX) - Vega Buyers + Vol Increase + Earnings Approaching

JTX is trading ~4.15 with earnings 12/9 (BMO). The IV30TM is up about 11%today as well. You can see the Livevol Pro Summary below


You can generally expect a vol increase into earnings, but JTX has shown large vol increases of late. You can see the Charts Tab below - I look at IV30TM vs. HV20TM. Note the recent vol increase (click image to enlarge).


There have been some interesting trades of late. You can see below on the Level II window the open interest chart on the Apr 5 Calls (click image to enlarge). Note the open interest jump:
12/1/09: 2,133
12/2/2009 13,692


Going to Time and Sales Tab (below: click image to enlarge) I have selected all the trades over 250 contracts on that date (12/1) in those calls. You can see they were predominantly purchases (green is trading on the offer - ususally cust buying).


The Jan 5 calls also have a large OI of ~10,800. So what's up?

Well, vol is increasing, earnings are coming up, opening long vega positions a plenty, increased option action (the company only averages 735 contracts a day - over 15x traded recently). Might be worth a look.

Legal Stuff:
http://www.livevolpro.com/help/disclaimer_legal.html

Wednesday, December 2, 2009

Regional Banking ETF (KRE) - Betting on a Big Move

KRE is a regional banking ETF. You can see the Livevol Pro summary below.


The ETF averages about 5,800 contracts traded a day but has done over 12,000 in the first hour and half of trading today. Looking closely at the Company Tab (snap below - click to enlarge) you can see that the volume has been puts and calls on the offer (customer purchases).


You can see the largest trades of the day were 5,875 March 15/25 strangles (11,750 total contracts accounting for over 90% of the days volume with this one trade). Someone paid 0.70 5,875 times or a ~$410,000 bet. You can see the biggest trades below (click image to enlarge).


The Options Tab (below) shows that the puts have substantive OI relative to the trade size, but the calls do not. The calls are definitley opening - puts we are not sure (until we see tomorrow's OI). Having said that, I think it is an opening order.


So what does this mean? Someone is betting nearly half a mill that the regional banking etf goes below $14.30 or rises above $25.70 by March. That's down ~33% or up ~ 25%. That's a big move especially considering the 52 wk. price low is 14.34.

Legal Stuff:
http://www.livevolpro.com/help/disclaimer_legal.html

Tuesday, December 1, 2009

Sun Microsystems (JAVA) - Straddle Trades; Bet Against Deal?

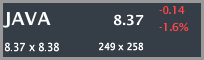
JAVA is trading at around 8.38 as of ~12:30 EST on Tuesday. You can see the Livevol Pro Sumary below.


ORCL is trying to take over JAVA for $9.50 (see Corporate Action window below - click to enlarge). So why is it trading over 10% below the deal price?


The EU seems to be taking exception to the ORCL takeover - the saga has gone on for quite some time. Essentially the EU sites anti-trust violations and are attemptiong to block the deal. The back and forth has gotten quite heated of late.

I saw from the Company Tab (below) that 7,500 Jan 9 straddles were purchased on the offer for $1.02. You can see the Company Tab biggest trades below (click to enlarge). The Options tab shows that over 8,200 in total have traded (also click to enlarge).


So what? Well, if someone is paying $1.02 on the 9 strike - they break even above $10.02 and below $7.98 for that long straddle.

Well, they probably aren't betting on a higher takeover price - so it's an $800,00+ bet that the deal falls apart as I see it. It is possibly betting another suitor - not ORCL - that will not get blocked is coming in with a higher price than ORCL's $9.50... Might just be a vol bet if deal gets less and less likely and vol spikes... Interesting... All wins in this one bet on a dramatic change.

Legal Stuff:
http://www.livevolpro.com/help/disclaimer_legal.html