The ETF has traded over 16,000 options on total daily average option volume of just 2,988. All but 150 contracts have been puts. The largest trade was 15,000 Dec 14 puts bought for $0.75 on a 34 delta against $14.92 stock. The Stats Tab and Day's biggest trades snapshots are included (click either image to enlarge).


The Options Tab (click to enlarge) illustrates that the puts are opening (compare OI to trade size). You can see almost nothing else has traded today; just 16,000 puts - of which 15,000 were a single trade.

Trade Stats
Buy 15,000 Dec 14 puts for $0.75
Buy 15,000*100*.34 = 510,000 shares of stock for $14.92
Max Loss (at $14) -$1,594,200
Breakeven Low: $12.39
Breakeven High: $17.12
This is a lopsided straddle (~2 puts for every 1 call). It gets long $55,500/vol (i.e. vega). So, this is a vol bet as much as it is a bearish straddle. Someone is betting on a hard downward move in Hong Kong.
The Skew Tab snap (click to enlarge) illustrates the vols by strike by month.

This is exactly why skew charts are cool. We can see clearly how the customer buying interest has shot the vol in the Dec 14 puts above the other months while the Dec 13 puts are below the other months.
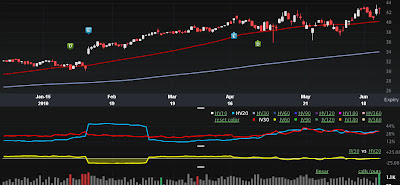
Finally, the Charts Tab (6 months) is below (click to enlarge). The top portion is the stock price, the bottom is the vol (IV30™ - red vs HV20™ - blue). The yellow shaded area at the very bottom is the IV30™ vs. the HV20™ vol difference.

It sort of looks like a reverse chart of the VIX from the earlier post. Vol is above the historical, the price has dipped recently and a huge vol buyer just stepped in.
This is trade analysis, not a recommendation.
Legal Stuff:
http://www.livevolpro.com/help/disclaimer_legal.html